

|
Getting your Trinity Audio player ready...
|
From an era of using special ink pens and sketch pads to Artificial Intelligence (AI) tools, researchers have come a long way in terms of creating scientific illustrations! Visually appealing figures, graphical abstracts, infographics, vector images, and graphs can help convey your intended message in an effective manner. And with rapidly evolving AI tools at your disposal, creating scientific illustrations is now significantly simplified. Yet, human oversight remains critical.
Here are six useful options for image creation, merged with generative AI features, which can help researchers create scientifically accurate illustrations and graphical abstracts.
6. General AI Image Generation Tools
1. Mind the Graph
With a suite of over 50 illustration categories, Mind the Graph gives you access to high-quality images, icons, graphics, and templates to help create scientifically accurate illustrations.
PROS
- The platform is primarily template driven, making it an excellent starting point if you already have a rough idea of how your output figure should look.
- Categories are divided by disciplines (medicine, STEM, Humanities, etc.) and subject areas to generate customized options for your field of interest.
- If default templates do not match requirements, you may design figures from scratch using theme-based icons from its gallery.
- User-friendly workspace for uploading your own graphics, choosing icons/illustrations suggested by the tool, creating various types of charts, adding text, changing backgrounds, and prompting AI for generating images.
- Options to create graphical abstracts, infographics, posters, slides, and illustrations for research papers.
Here’s a sample graphical abstract created by Mind the Graph. Observe the use of panel-like structure to help maintain the flow of the timeline. The color composition is neutral, ensuring that the figure does not visually overstimulate the viewer. Such templates are available on the platform to be customized per your requirements.

CONS
- The AI generator feature is currently in beta phase and may not be fully efficient.
- Because the platform is not entirely dependent on generative AI, manual effort is required. But this ensures that your control over figure creation is not compromised.
2. FigPad.ai
PROS
- FigPad offers an easy-to-use workflow for creating scientific diagrams. It follows a simple, straightforward text-to-image conversion engine.
- Customized prompts can be input to generate figures, posters, graphical abstracts, and vector graphics (SVG format).
- Allows users to edit and export SVG files, enabling fine-tuning of figures within the tool.
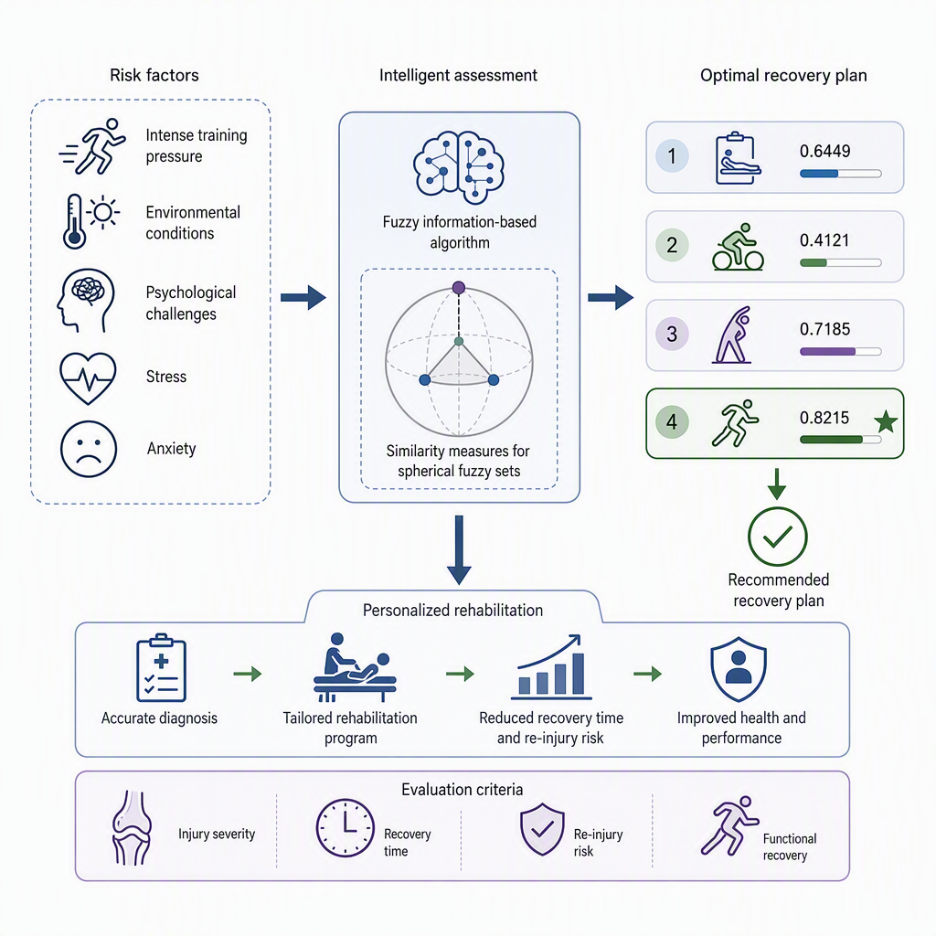
Here’s a graphical abstract generated by inputting a textual abstract from a published research paper [1] in FigPad’s text-to-image engine.
CONS
Although the figure output may look publication-ready, experts must verify accuracy. Take the above generated sample graphical abstract, for instance.
- Textual information is minimal and the arrows used do not clearly convey the flow of information within the image.
- Visual representation of fuzzy sets and fuzzy algorithm appears generic and not sufficiently specific to represent the authors’ proposed method.
- The “Evaluation criteria” panel placed at the bottom appears as an endnote rather than being part of the research analysis’s workflow.
The takeaway? The final output cannot be used as is and needs further modifications, either on the same tool or on a different design tool like Canva and Adobe Illustrator.
3. BioRender
A popular tool for effective visualization, BioRender has a curated library of icons spanning fields like cell biology, microbiology, and anatomy.
PROS
- The workspace uses a classic drag-and-drop feature, enabling users to build custom research figures.
- Allows easy collaboration for students working on a project or lab teams because of its shared workspace.
- Offers automated data formatting and graphing by analyzing raw research data.
- AI features have expedited the end-to-end figure creation process. One of the newly introduced AI features is make-your-own-icon, wherein users can create customized icons BioRender-style to maintain consistency.
CONS
- The AI engine is a suggester and not an image generator, meaning figures should still be created using the drag-and-drop feature. Some of the features are in the beta testing stage.
- The fixed BioRender-style figures may be highly common and easily recognizable. So if you are looking for a stand out graphic, this is not the ideal image creation tool.
4. SciSpace
PROS
- SciSpace operates similar to FigPad, where you can enter an entire textual abstract and obtain a graphical abstract.
- Offers options to extract data and generate diagrams among several other “tasks.” Prompt the tool to run the task of your choice, either using customized prompts or curated prompt templates from the platform’s repository.
- After the task is complete, you may renter prompts to refine the output.
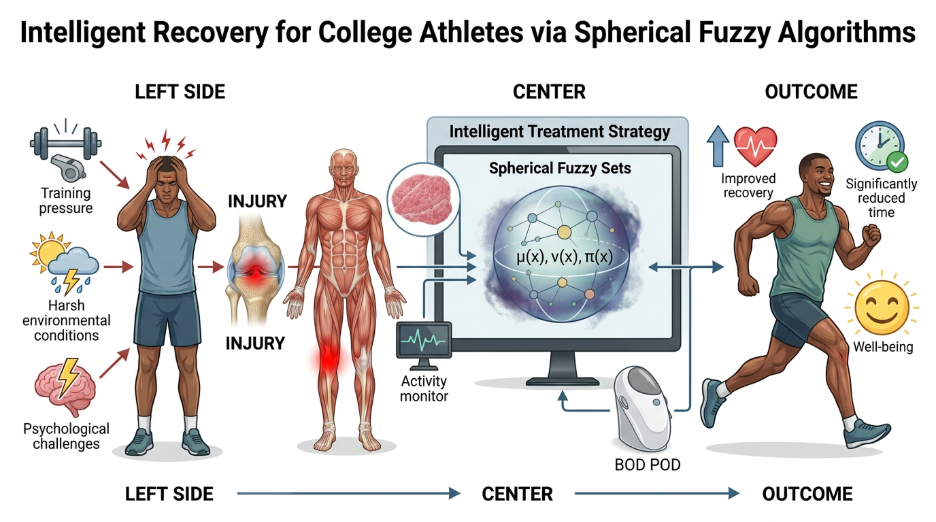
The same abstract from the published research paper [1] was used to generate the following graphical abstract:
CONS
- As seen in the above example, the initial output appears misaligned with the intent. The vague panel headings (left side, center, outcome) are not helpful for effective visual communication. Moreover, words like “injury” have been unnecessarily repeated.
- The icons and graphics seem to overstate the analysis without properly conveying the methodology proposed by authors.
- Further AI prompts would be needed to refine the figure until a satisfactory outcome.
5. Napkin.AI
PROS
- Napkin.AI works directly from rough drafts and texts rather than relying on AI prompts.
- Gen AI feature is integrated into the tool to suggest suitable outcomes based on input text, allowing users to choose the best suited option from the generated images.
- The workspace has the option to polish and refine the result by moving/replacing icons, modifying text, ungrouping/grouping visual elements, etc.
CONS
- Mostly useful for non-academic purposes like creating marketing copies, visuals for training materials, social media posts, etc.
- Users find the layouts and formats slightly repetitive, making the figures visually unappealing after multiple uses.
6. General AI Image Generation Tools
There are several gen AI tools like ChatGPT (Dall-E), Perplexity, Quillbot that offer image generation features. But since they are not specifically meant for creating scientific illustrations, the generated outputs could require significant modifications. Here are three graphical abstract samples generated from each of the tool using the same text abstract [1] in the prompts:
ChatGPT (Dall-E)
Dall-E 3 is the latest Open AI model that shows a more nuanced output when generating images. Compared to its predecessors, Dall-E 3 produces more realistic designs, with near-accurate visual icons and textual content.
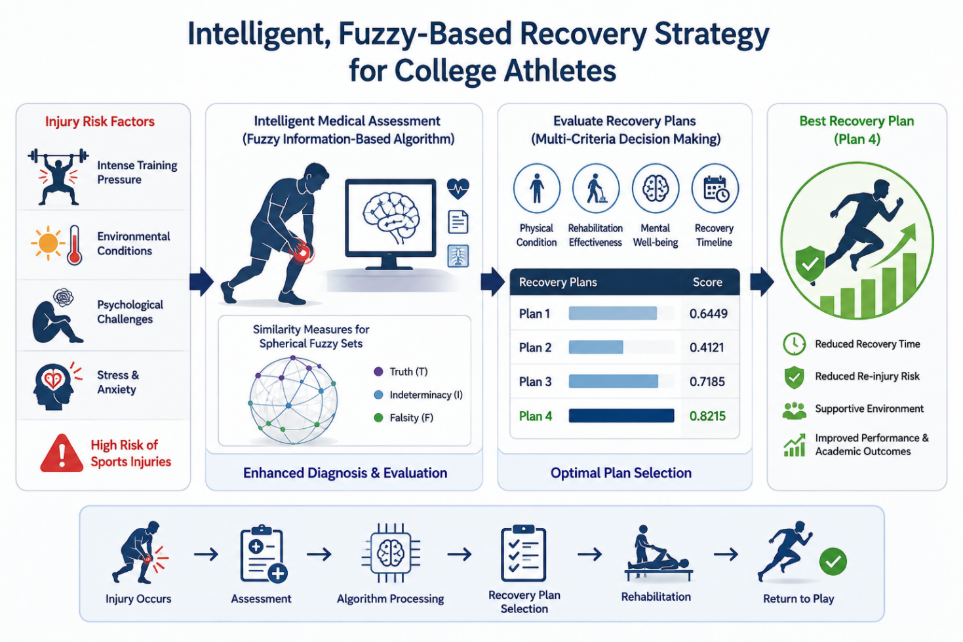
The panel style structure of the graphical abstract makes for an easy-to-read visual. The important aspects of the research have also been covered. However, too much information appears to have been cramped into the image with not enough clarity in text, icons, and graphics. It would perhaps have looked better with fewer visual elements. This means you would have to continue prompting the AI engine until you receive a satisfactory output.
Perplexity
In a significant contrast to the Dall-E output, Perplexity designed a minimalistic graphical abstract with just enough visual elements and textual content so as to not overwhelm the viewer.
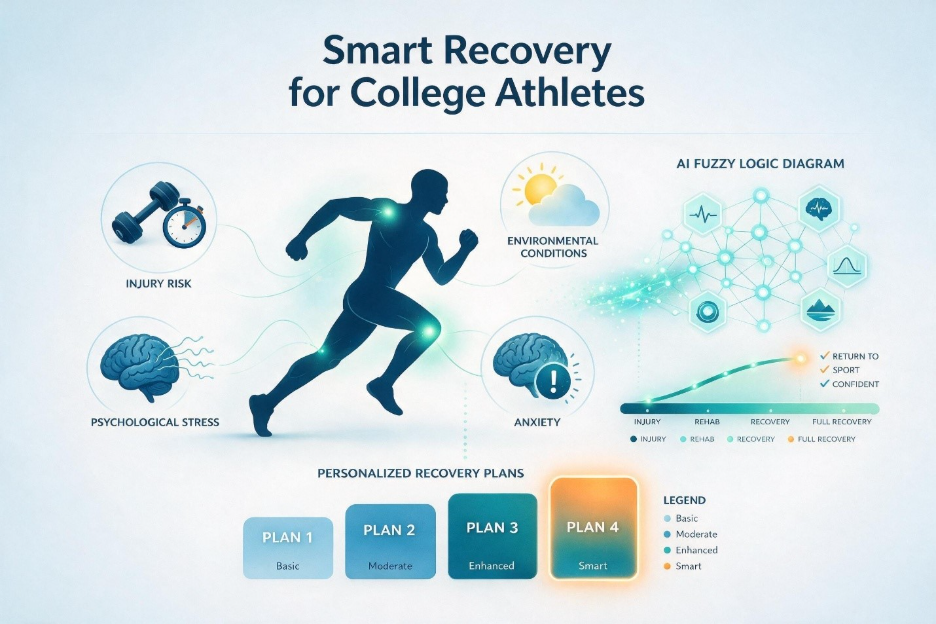
The images seem to highlight the background of the study—the causes or factors influencing the causes for sports injuries and why a smart recovery plan is needed—more than the methodology and results, failing to emphasize the key take-home message. The images do not appear balanced with the content. Moreover, the text is blurry and unclear. The AI fuzzy logic diagram would also require changes since a very generic design would not accurately convey the intended meaning.
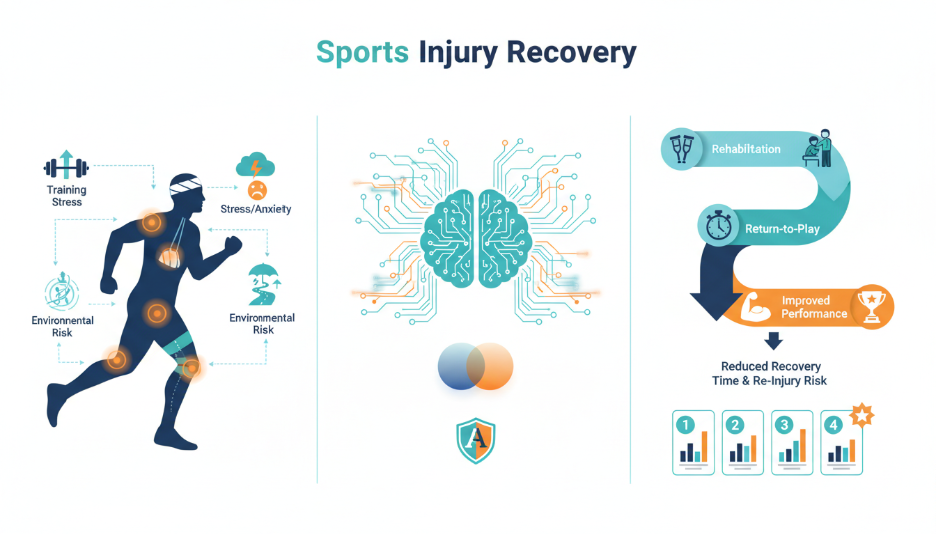
Quillbot
The graphical abstract generated by Quillbot also portrayed a minimalistic design. But the lack of textual content makes it difficult to understand what the research is actually trying to convey. The heading of the visual abstract appears vague and uninformative about the study itself. The key aspects of the proposed methodology are also not clarified.
Conclusion
One thing that’s obvious in all the above visual outputs is this: When using AI prompts to generate a ready-to-use image, none of the outputs are truly publication ready! They require significant modifications and considerable human intervention.
What this means: AI image generation tools are simply a starting point for creating scientific illustrations and not the ultimate fix for authors. These tools and platforms are great for getting ready-to-use layouts, templates, and formats that should then be refined and polished for customized figures. So, what can you do, as authors, to prepare scientifically accurate illustrations?
- Educate yourself on using image creation tools, preferably those designed with a focus on academia. These include Mind the Graph, BioRender, SciSpace, FigPad, etc.
- Decide the best tool for your requirement. Do you need a graphical abstract? A poster or slide presentation? Vector figures? Illustration specific to Life Sciences? Be smart about choosing the right tool.
- Try and combine tools when using generative AI. For example, the image generated on Dall-E or Quillbot could perhaps be perfected on a separate design tool like Canva.
- If handling tools feels overstimulating, choose expert illustration and artwork services to prepare your graphical abstracts, scientific drawings, and posters by simply describing your requirements.
Reference
1. Analyzing the causes of sports injuries in college sports activities and research on the recovery strategy using an intelligent approach https://www.nature.com/articles/s41598-025-96770-5



Leave a Reply